Reversing fetch()
The previous guide walks through using the strings module to discover client-side and server-side endpoints. This document walks through how you can use the interactive mode to reverse engineer the requests. This would require you to have some basic knowledge of reviewing JavaScript, or just code review in general.
The approach shown in this document is called the bottom-top approach, in which the pentester finds potential sinks and goes up to the source. If this statement seems a bit confusing, don't worry. You'll understand this in the document below.
Fundamentals
To start reverse engineering the JS files, you should first list out all the functions available in the app.
Before that, you should understand how the functions are distributed in the Next.js apps. Here's a brief overview of what you should know before you can start analyzing the code manually:
- When the Next.js apps are compiled, the functions get distributed into webpack having a specific numerical ID
- These files often contain the path
/_next/static/chunks - If you see the directory structure of the
outputdirectory, you will find the following structure
❯ tree
.
└── output
    └── <domain>
        ├── _next
        │   ├── data
        │   │   └── k7xKVnxmboK4SktY2dZWt
        │   │       └── index.json
        │   └── static
        │       ├── chunks
        │       │   ├── 12.7e6d2ac6e1808fc2.js
        │       │   ├── framework-64ad27b21261a9ce.js
        │       │   ├── main-710ab85aa9a8f10d.js
        │       │   ├── pages
        │       │   │   ├── _app-c449865c8af1faa0.js
        │       │   │   ├── _error-77823ddac6993d35.js
        │       │   │   ├── -af5a23529ce3c337.js
        │       │   │   └── 5D-af5a23529ce3c337.js
        │       │   ├── polyfills-78c92fac7aa8fdd8.js
        │       │   └── webpack-efff35ee26971294.js
        │       └── k7xKVnxmboK4SktY2dZWt
        │           ├── _buildManifest.js
        │           └── _ssgManifest.js
        └── cdn-cgi
            └── scripts
                └── 5c5dd728
                    └── cloudflare-static
                        └── email-decode.min.js
The files that you'll be mostly spending your time analyzing are the files in the ./output/\<domain\>/_next/static/chunks.
Upon reviewing the structure of each file, you'll find patterns like the following in most of the files:
(self.webpackChunk_N_E = self.webpackChunk_N_E || []).push([
    [614],
    {
        3253: function (a, t, h) {
            // --snip--
        },
    },
]);
Here, you will notice that three arguments - namely a, t, and h - are being passed. These variables have the following meaning:
a=> module: Represents the current module object. Contains metadata like exports, id, etct=> exports: The object that the module uses to export its public APIh=> require: The require function is used to import other modules
Now, suppose a function exports a particular action. This could be represented in multiple ways. One can identify these with practice; however, here are the most common ones:
Object.defineProperty(t, "appBootstrap", {
  enumerable: !0,
  get: function () {
    return n;
  },
}),
In this case, the variable t represents exports.
h.d(c, {
    $60: function () {
        return n;
    },
    qKv: function () {
        return r;
    },
});
In this case, the variable h represents an imported function, and the d is the method to define exports.
By understanding these, you should be good to go for reversing the apps.
Getting connections with the map module
The map module helps to simplify the process of finding connections. To get started with finding a connection, you have to download all the JS files. You can refer to the docs for the lazyload module for instructions on downloading JS files. Once you have all the JS files downloaded, you can proceed further with the map module.
You can get started with the following command:
js-recon map -d output/<domain> -t <tech> -i

# since the tool supports Next.js at the time of writing this, the command would be
js-recon map -d output/<domain> -t next -i
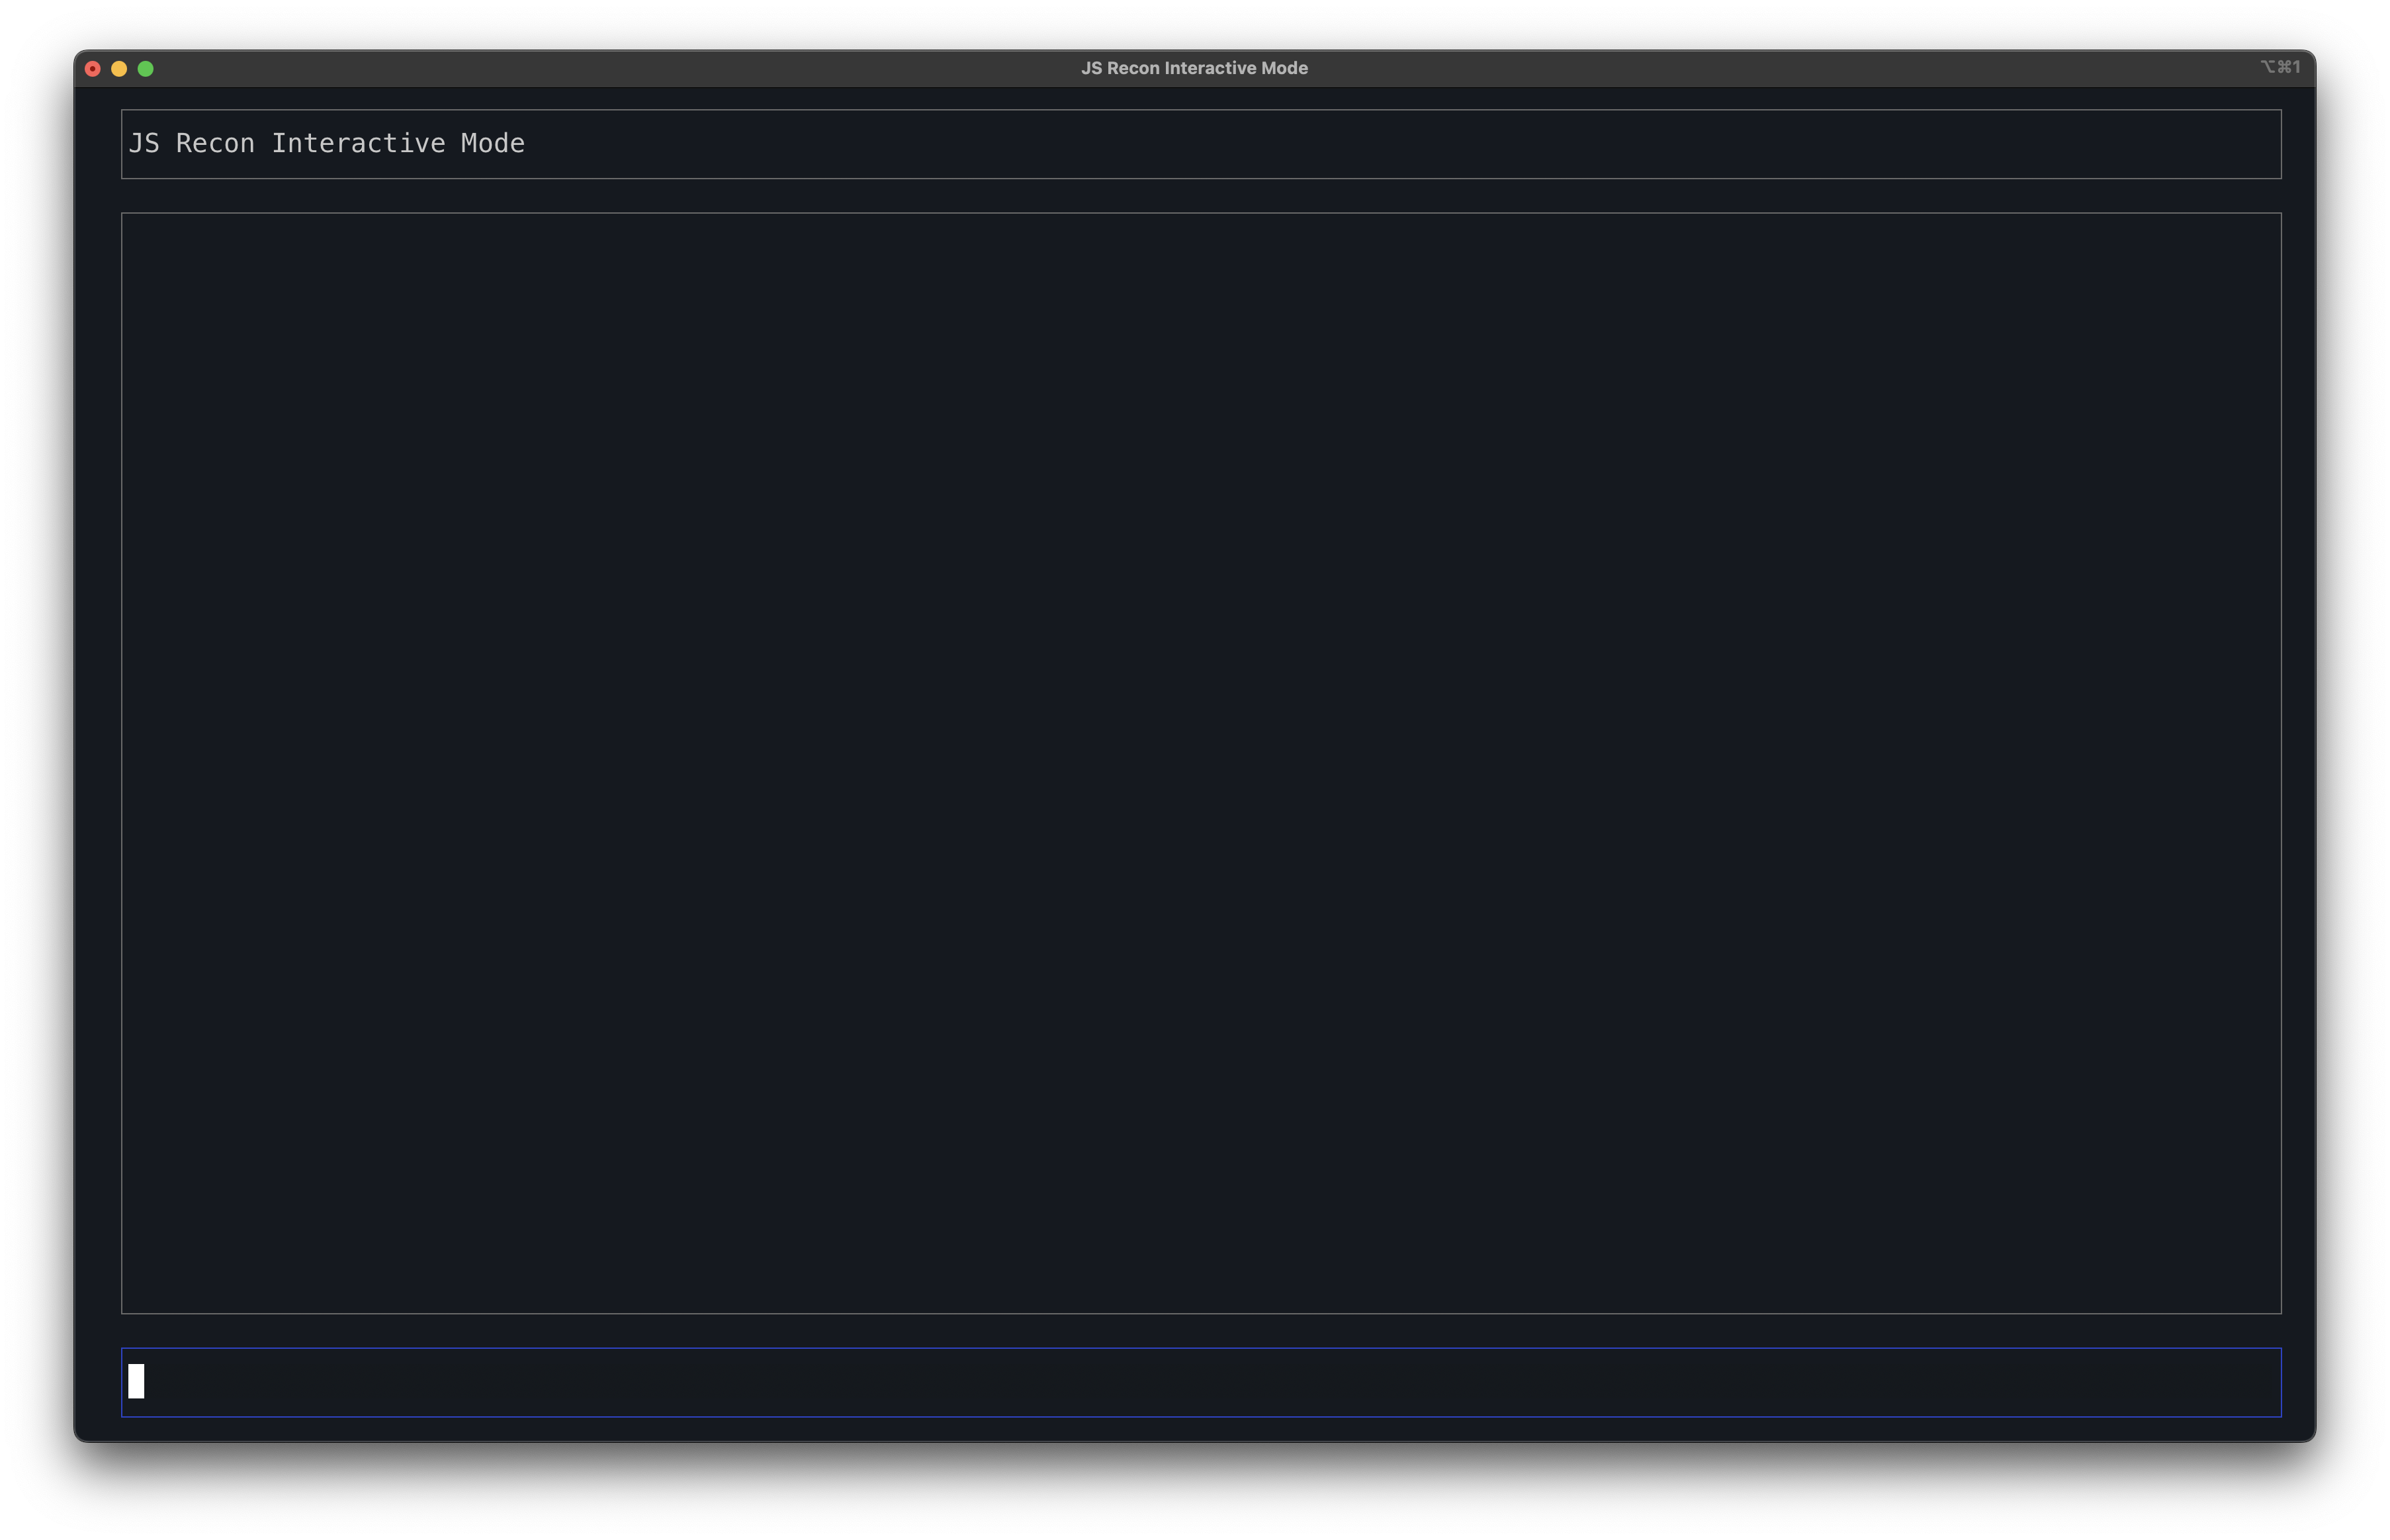
This will analyze all the files and open up an interactive shell like this:
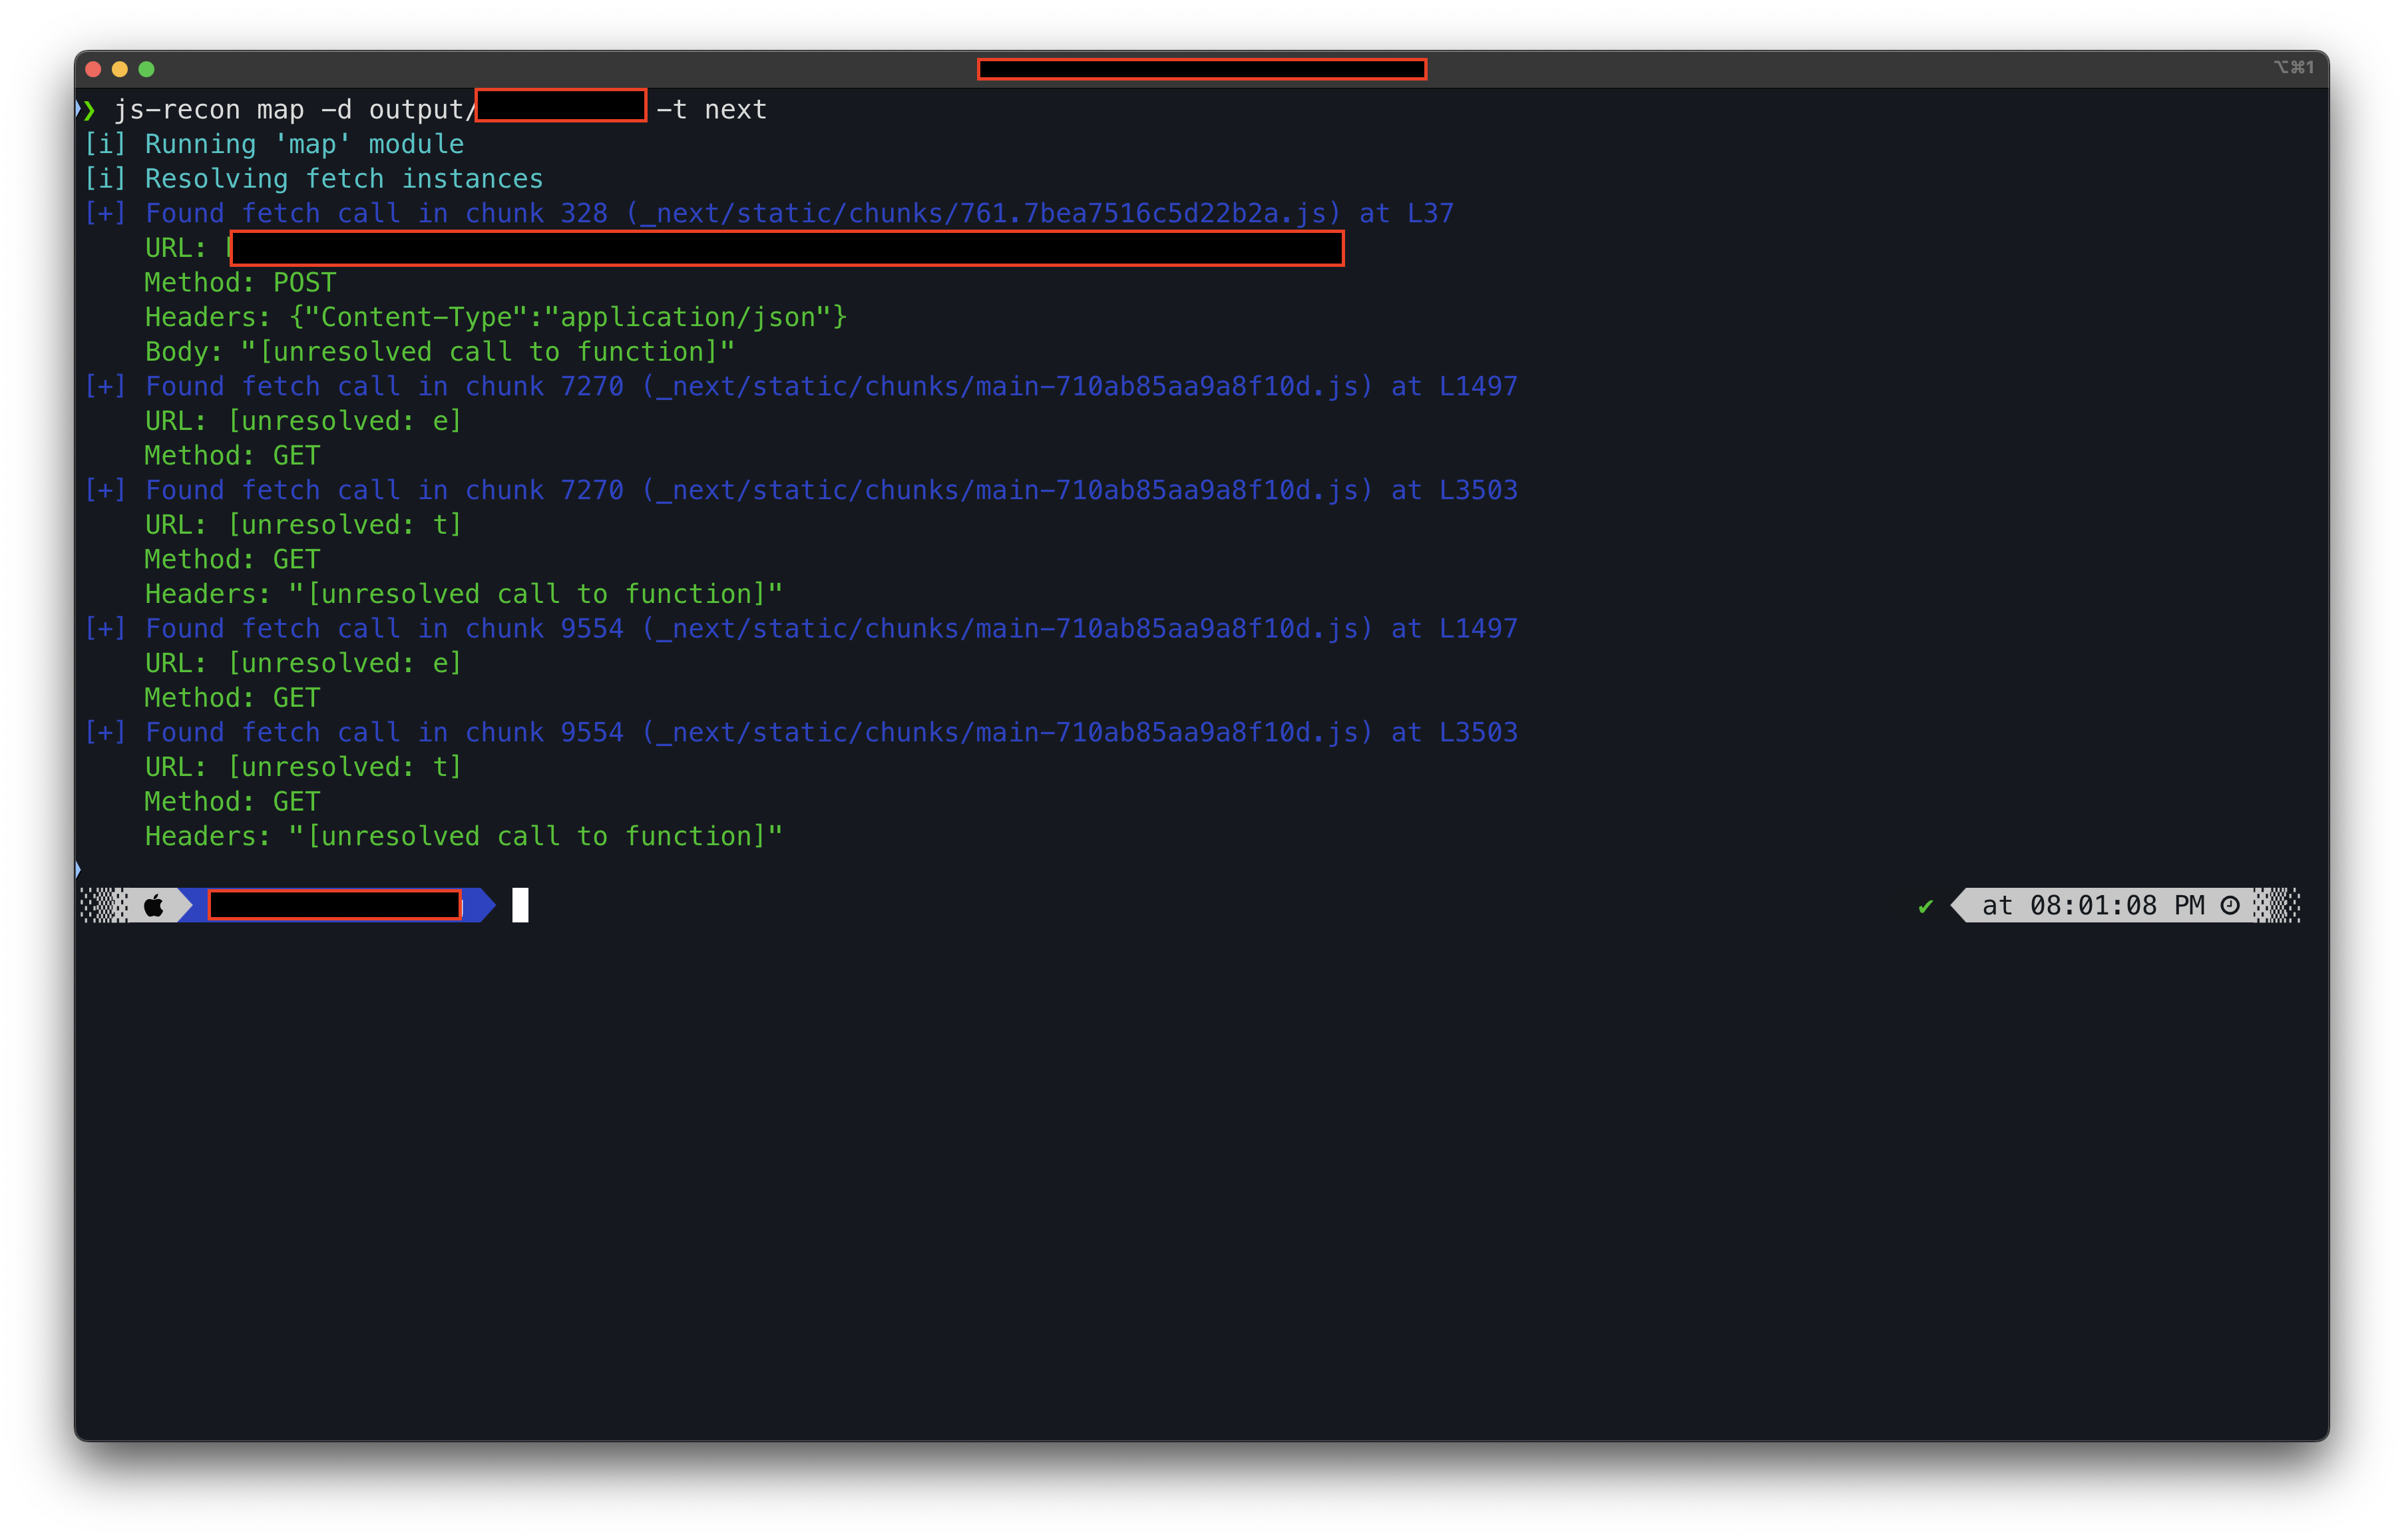
If you don't pass the -i flag, then the tool will just show the information it could extract from the JS files, like the fetch instances, AI descriptions (if enabled), etc. An example output is shown below:
Before getting started, you should run help in the interactive mode to see a list of available commands. Once you've read through the help menu, you can proceed further.
Listing all fetch() instances
When reversing for APIs, the first thing that you would like to do is to list all the instances of fetch(). To do so, you can run the command list fetch to get a list of functions that contain fetch().
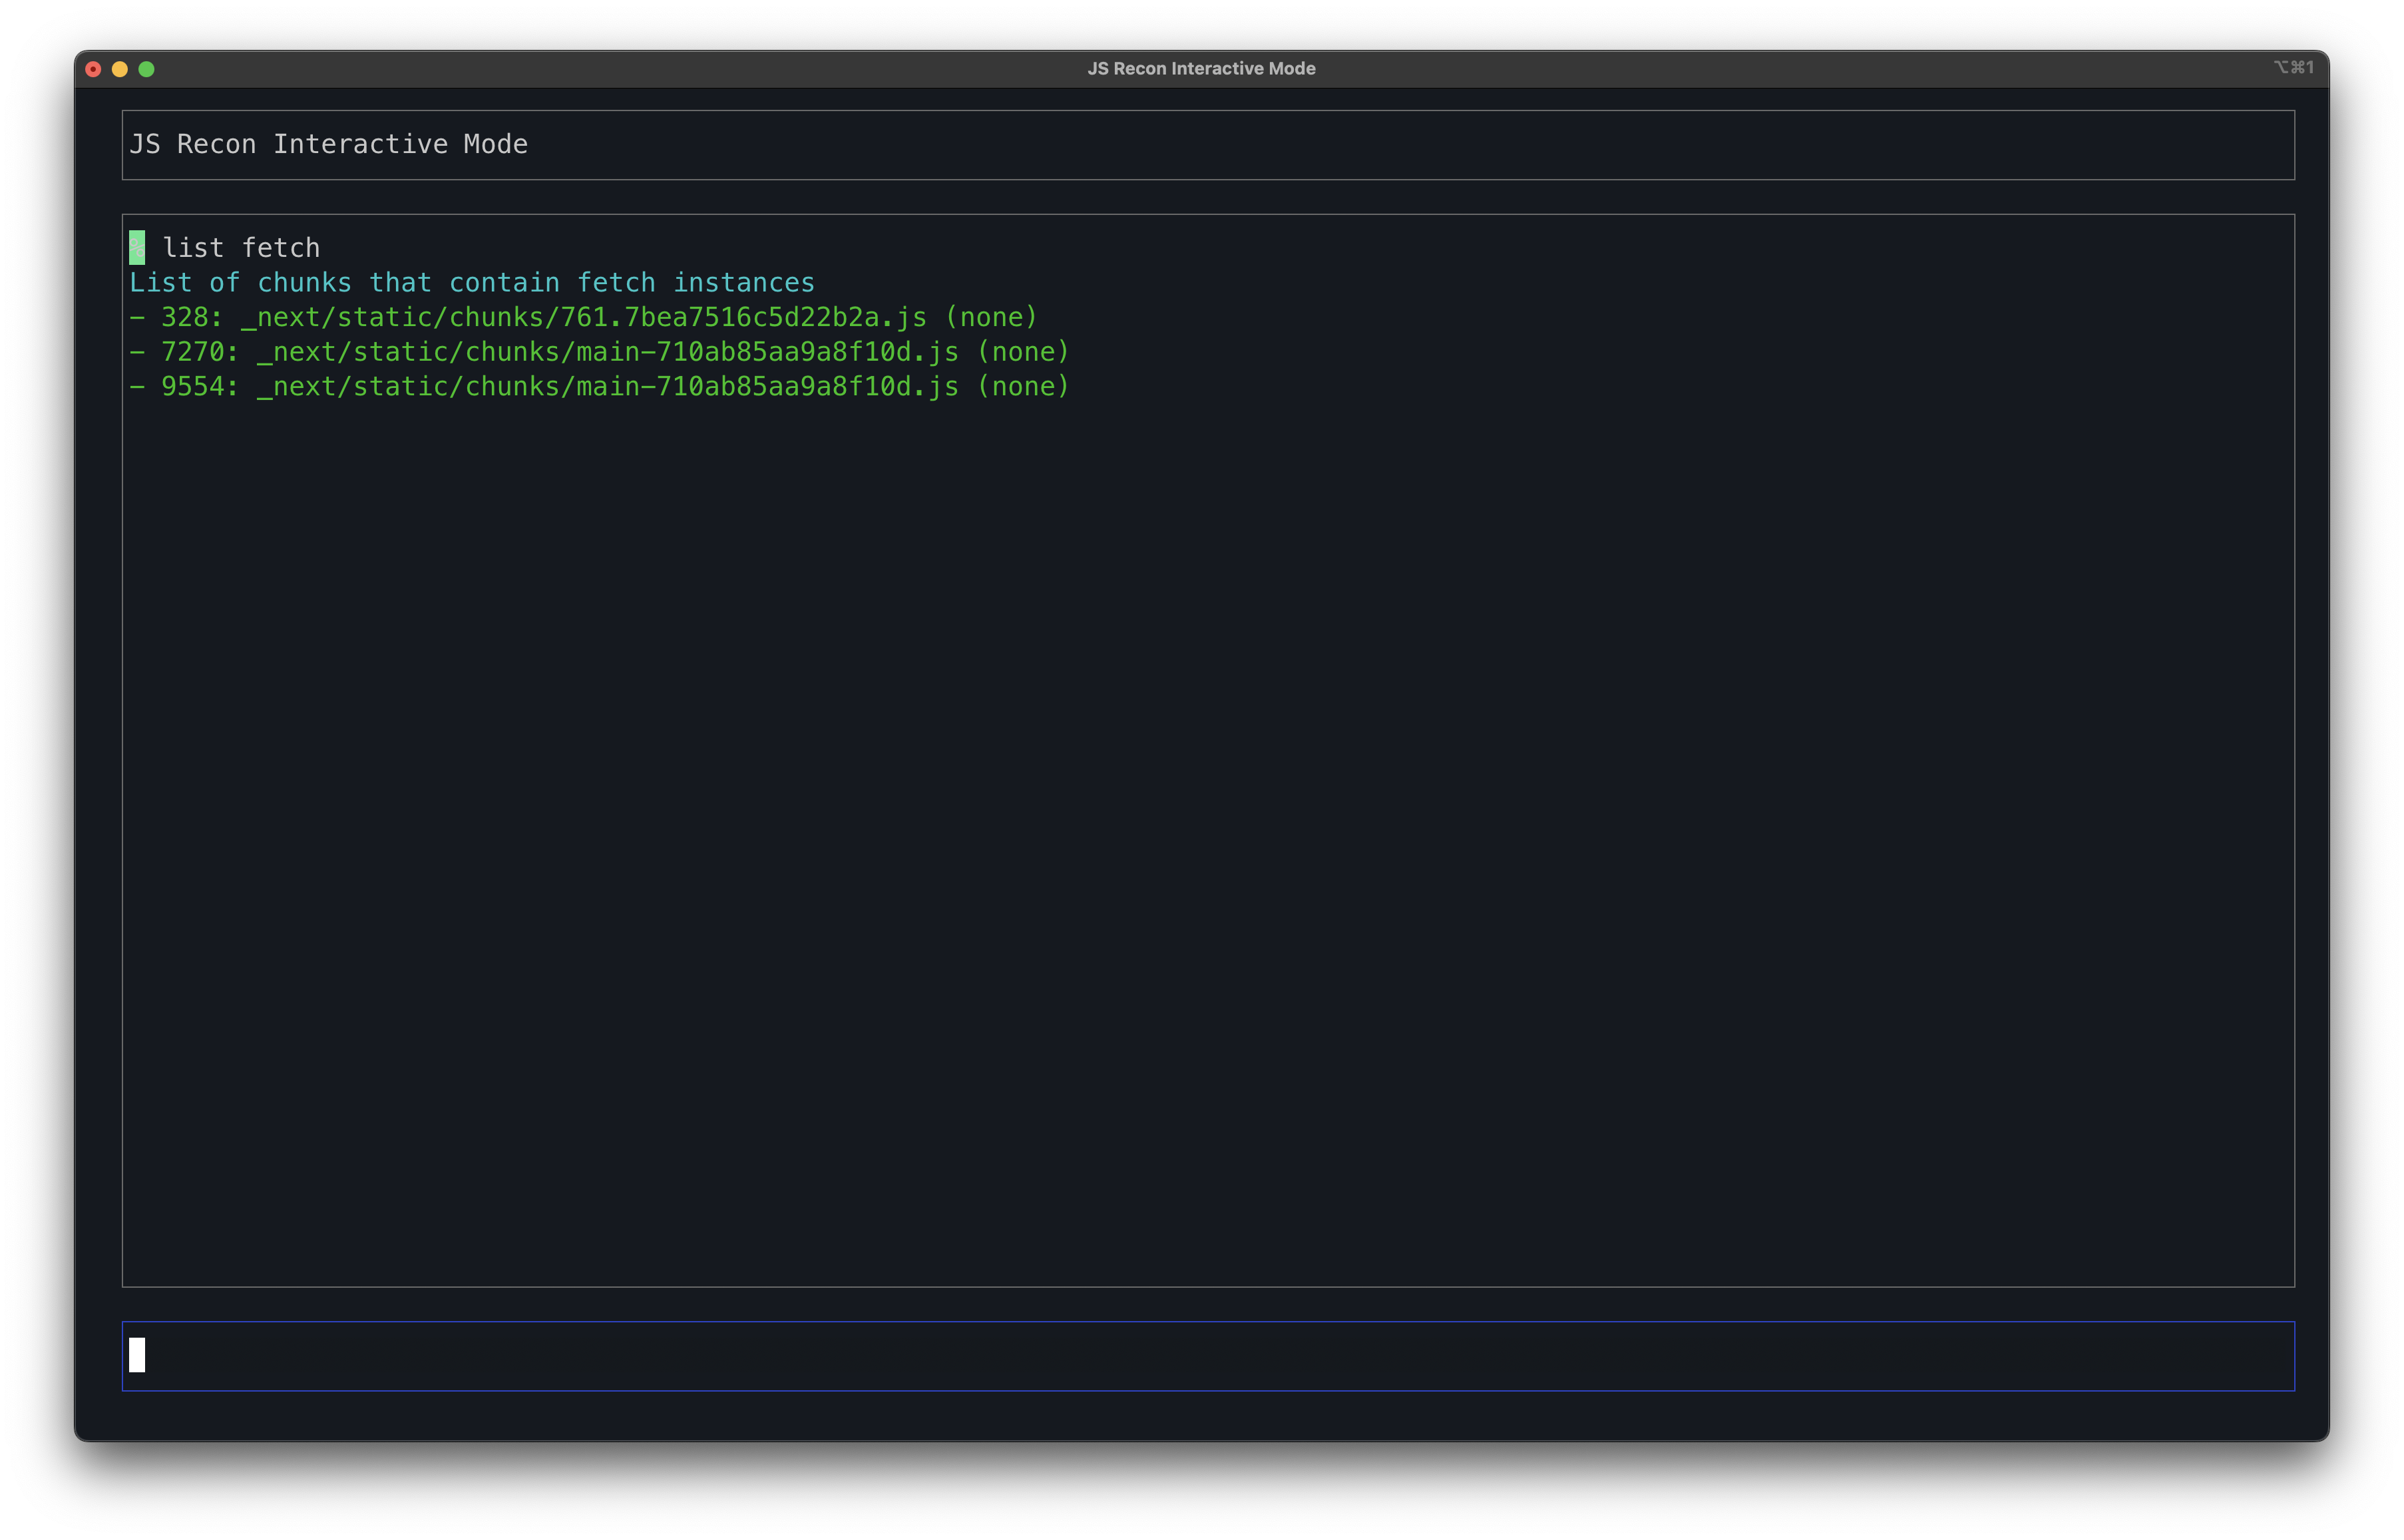
Here, the output format is the following:
- <function_id>: <file_name> (<function description>)
Getting function descriptions
Since there is no function description assigned, it shows none. You can use AI to generate function descriptions. Passing the --ai description flag to the js-recon command's map module will also generate an AI description for all the functions that it finds. You can refer to the docs for the same here
Navigating around functions
Now, you can write this function to a separate file to remove the hassle of having to navigate to that particular file. Run the following commands in interactive mode to write it to a file:
set funcwritefile <filename>
go to <function_id>
For example, from the above screenshot, if the pentester had to write the function ID 328 to a file 328.js, then the commands would be:
set funcwritefile 328.js
go to 328
After running the set funcwritefile command, if you run the go command, then the code for the specified/resultant function will be written to this file.
If you are just analyzing the files, you can go with a file name test.js - set funcwritefile test.js.
If you think the function does something important, then you can set the output filename to the specified function name - set funcwritefile 328.js
If the pentester also wishes to write all the functions that 328 imports, then they could set the value of writeimports to true
set writeimports true
Now, this will also write the code for the imports for the specified functions.
Imports do not just mean the external libraries the developers used in that particular function, but they could also mean UI components, other functions that also have a fetch(), etc.
Following the execution flow
Suppose you got an interesting function and you want to know the execution path for it. You can do it in the browser, but JS Recon also provides a way to do so.
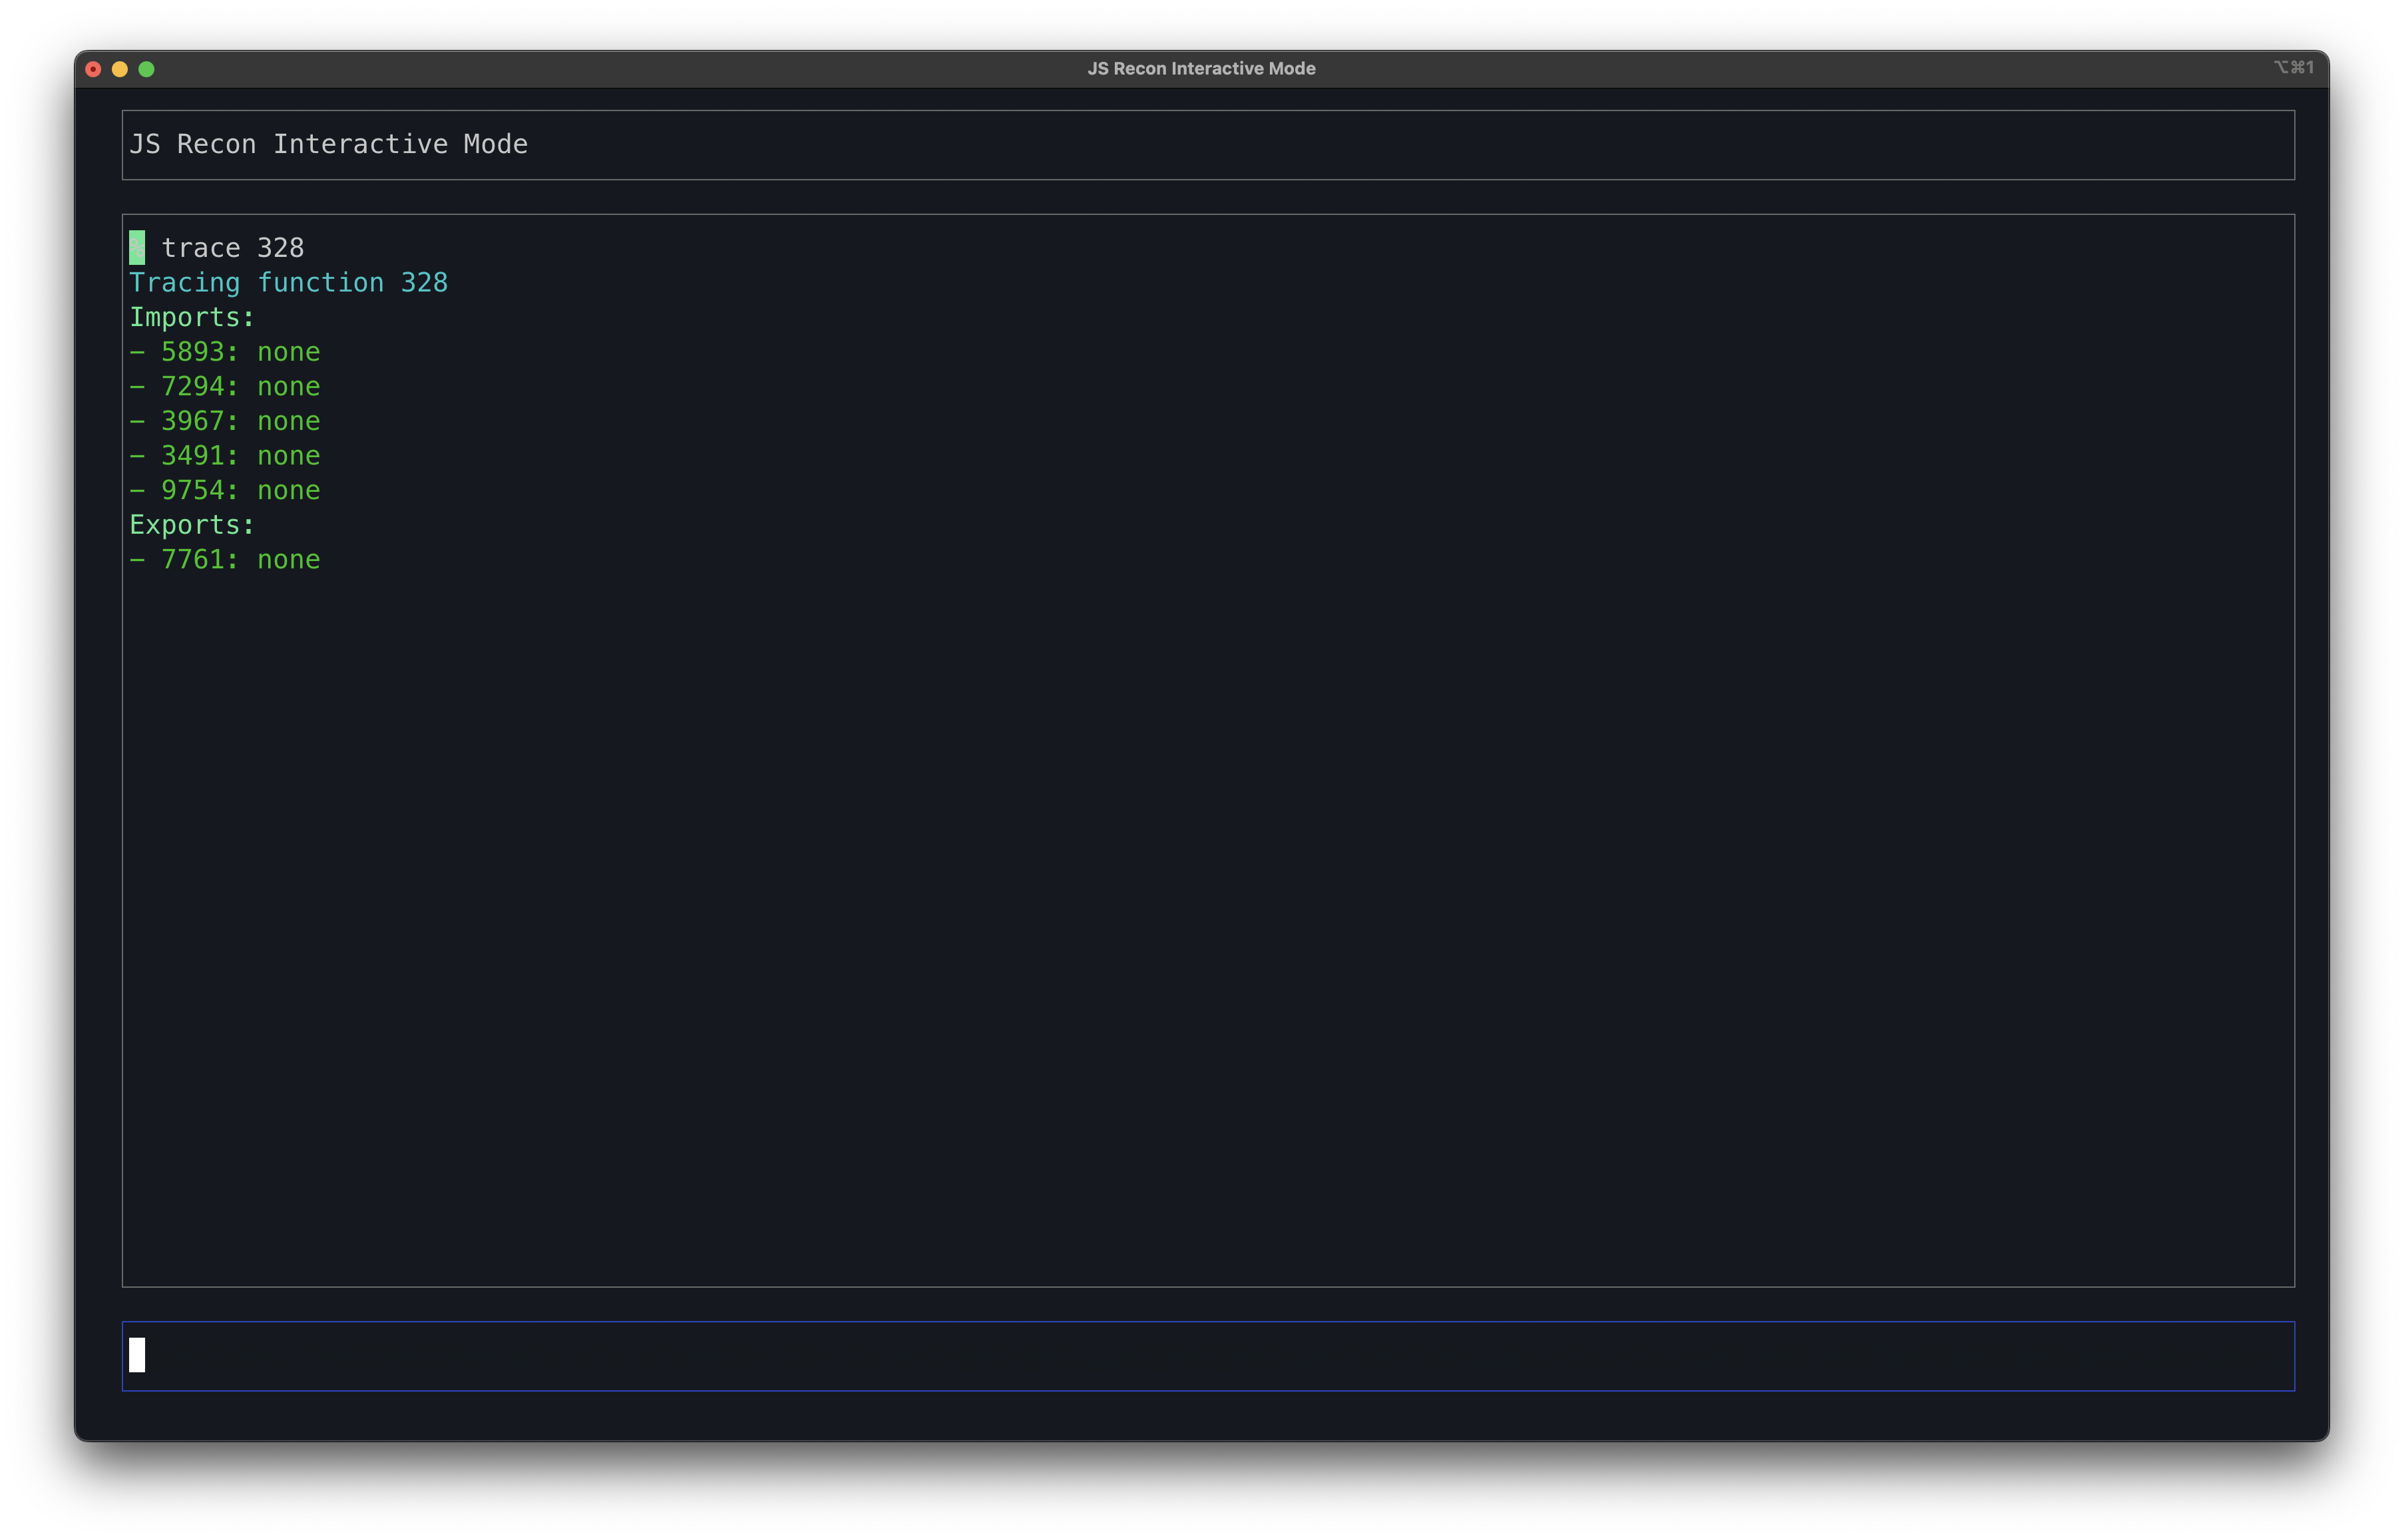
For example, you can assume that the function is 328. Now, the pentester can run the following command to get a list of imports and exports for that function:
trace 328
Once you have the imports and exports, and then you have inspected the code for several functions using the go to command, and now you would like to see the history, you can run the following command:
list nav
While tracing a particular execution flow, you realized that you are not going the right path, then you can run the go back command, and it will print the code for the last function that you used the go to command with.